On Friday I will be presenting some recent network analysis work from the Clique Research Cluster at the ACM Web Science conference in Paris (WebSci’13). In many social networks, several different types of relations will exist between the same set of users. For example, a Twitter user can be represented by the words in their tweets, the URLs they share in tweets, their personal follower graph, graphs based on their retweets or mentions, or using some representation involving the Twitter user lists to which they are assigned. Each of these represents a different view on the same social network.
The existence of multiple heterogeneous types of information about users makes the application of many data analysis tasks more complex – for instance, community finding or data visualisation. To deal with this problem, earlier this year we developed an unsupervised machine learning approach for combining information from multiple views of a social network to produce a single unified network. The original views can either be feature-based (e.g. tweet content) or relational (e.g. follower networks), and the approach doesn’t require the views to be priortised or weighted (e.g. we do not need to pre-determine that follower information should be weighted more highly than tweet content).
Methodology
Our approach involves applying a two phases process to a multi-view dataset:Phase 1: For each user, we compute a neighbour set based on information from all views. We do this by computing the similarity between that user and all other users in each view, and ranking these similarities. Any suitable similarity measure can be used (e.g. cosine similarity, Jaccard set similarity, inverse Euclidean distance). A combined ranking is computed using SVD Rank Aggregation (see here for more details on this method for merging ranks). From the output of the rank aggregation process, we select the top k ranked users as the neighbour set of the current user, where k is a user-defined parameter.Phase 2: We merged the neighbour sets for all users into a single unweighted directed asymmetric k-nearest-neighbour graph, where each node is a user and an edge exists from node X to Y, if the corresponding user Ux is in the neighbour set of user Uy. This yields a unified graph encoding connectivity information derived from the individual views, covering all users were present in one or more of those views.
Examples
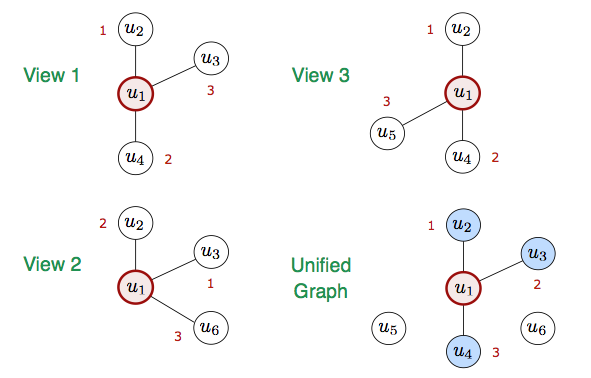
As a simple illustrative example, below shows a dataset with six users, represented in one or more of three individual views. Aggregating the neighbourhood sets for k=3 results in a single unified graph as shown bottom-right:
To test our approach, we collected tweets and network data for high-profile Twitter accounts to create four topical Twitter datasets, relating to UK Politics, Rugby Union, Premier League Football, and the 2012 London Olympics. Pre-processed versions of these datasets are available online here. Each dataset has a corresponding human-curated set of “ground truth communities”. For example, for the politics dataset, the ground truth consists of different politics groupings, while for the football dataset the ground truth corresponds to the twenty clubs in the Premier League. By calculating the consistency with which users shared neighbours assigned to the same ground truth community, we could quantitatively measure the extent to which unified graphs preserve the key associations between users from the ground truth communities.
Visualisations
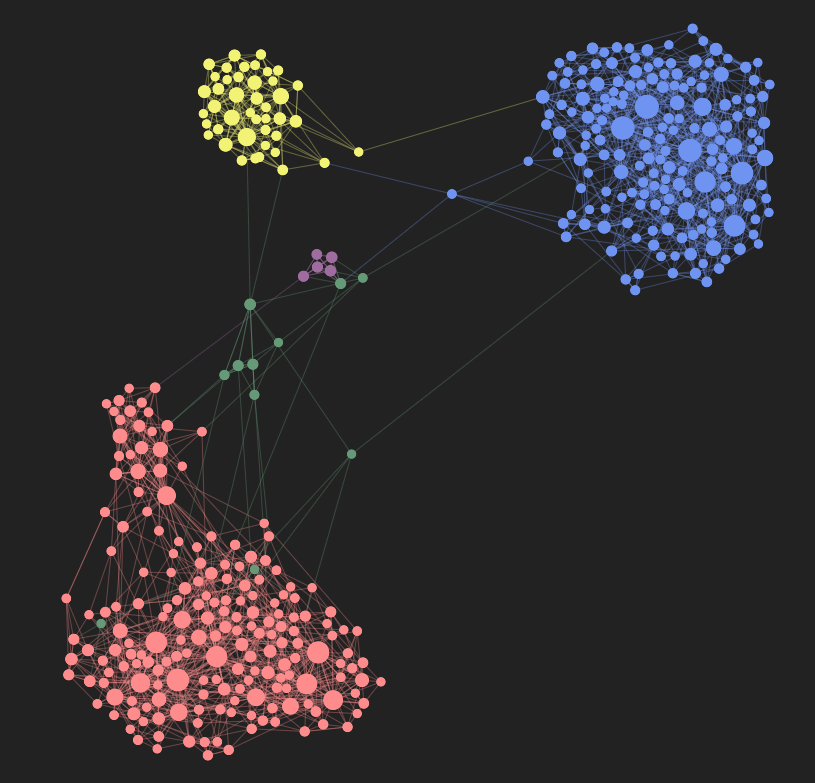
The image below shows a visualisation of the unified graph generated from the Politics-UK dataset. The visualisation was produced using a force directed layout in Gephi. Each node corresponds to a UK Member of Pariliament (MP), as listed on Tweetminster. Nodes are coloured according to their political affiliation, and scaled according to in-degree. We can see a clear separation between the major political groupings in the UK (e.g. Labour in red vs Conservative Party in blue). We also see a small number of Independent MPs (green nodes) with a high level of connectivity to the Labour community – such as former Labour MP @georgegalloway.
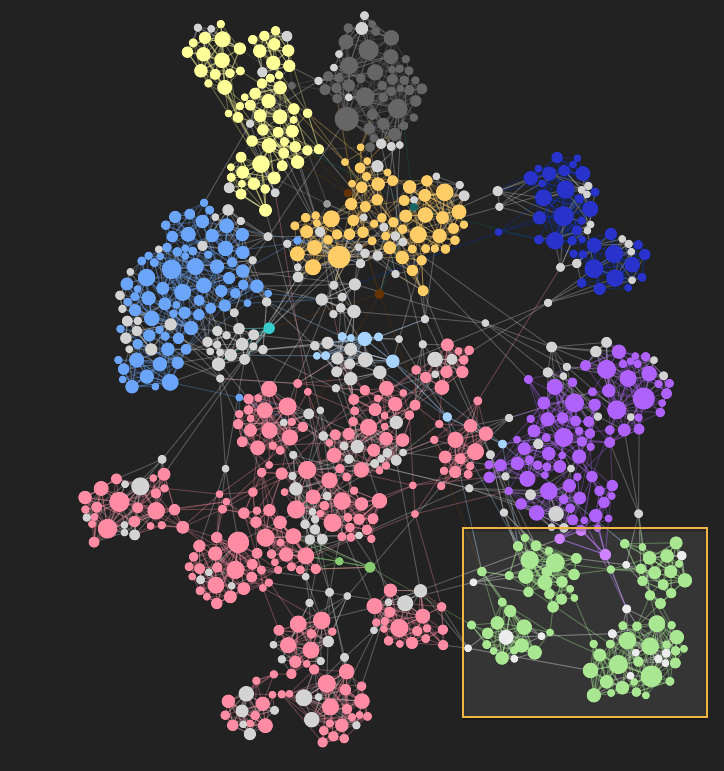
In addition to facilitating visualisations where the ground truth communities are well-separated, our approach also supports the discovery of new sub-communities that were not identified by human annotation. For instance, the image below shows a visualisation of the unified graph generated from the Rugby dataset. Here each node corresponds to the Twitter account of a rugby player, club, or organisation. Nodes are coloured according to nationality. In the highlighted region, which corresponds to nodes assigned to the “Ireland” ground truth community, four distinct sub-communities are visible. These correspond to provincial Rugby teams within Ireland – clockwise Leinster, Munster, Ulster, and Connacht.
Interactive versions of unified graphs for several datasets are online here, which were generated using Gephi and sigma.js. Currently, we are looking to extend our approach to cross-network analysis, involving the combination of views originating from multiple distinct social media platforms, e.g. Twitter, YouTube, Facebook. In the meantime, full details of this work are available in the paper below:
— D. Greene and P. Cunningham, “Producing a Unified Graph Representation from Multiple Social Network Views,” in Proc. ACM Web Science 2013, 2013. [PDF] [BibTeX]